Tools
Panoptikon provides a great variety of functions, but all of them have the same application structure in common. Indeed, every user who enters the system can view on the home page the application profiles for which he/she has been authorized to operate. Although Panoptikon is made up of many modules with hundreds of functions, the organization of information always respects the same basic rules. In this way, being oriented it is much easier and the new functions can be used in a few moments by the users.
Standard Tools
Each function of Panoptikon has the following basic tools:
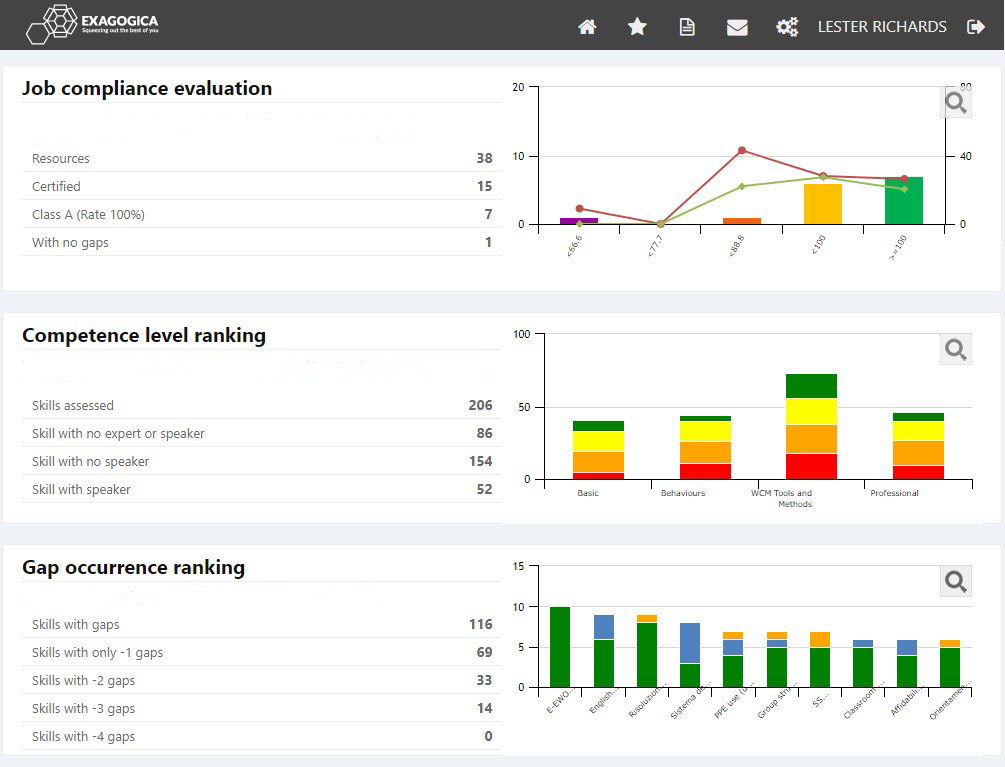
1. Indicators. Each user profile starts with a dashboard that presents the available functions. Each function is represented by the key indicators that immediately inform the user if and how he/she should operate in that area. Key indicators (for example how many people I manage, how they are distributed, how many of them achieved a positive result, etc.) are also displayed in graphical form. In this way, you can examine the situation and fix the priorities at a glance.


.png)
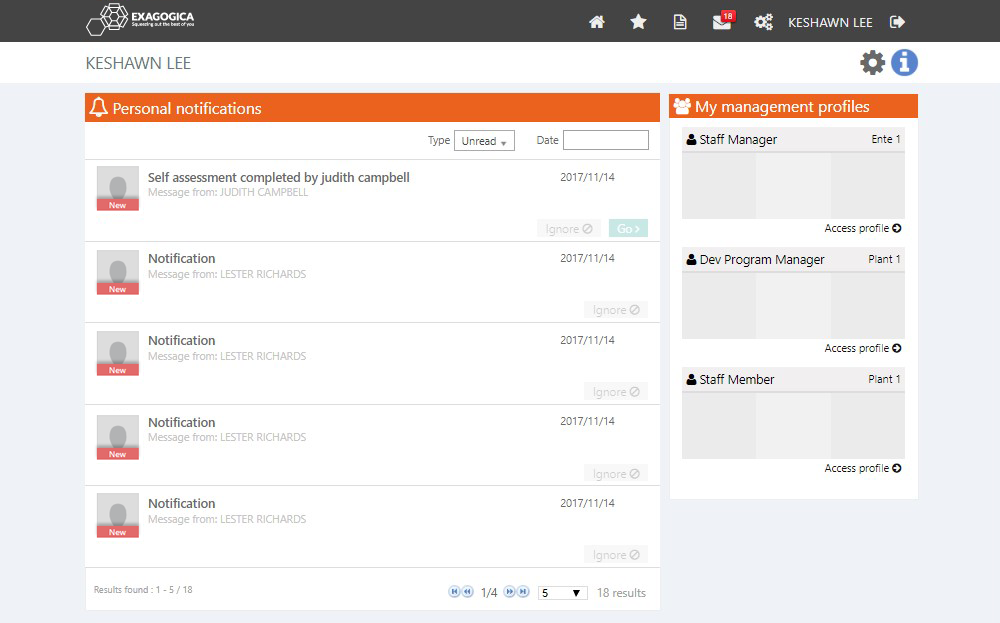
Notifications
A modular ERP system like Panoptikon allows to manage even very complex workflows, in which some users process data that are not of their exclusive interest but also of tens or hundreds of other users. When changes are made by other operators to the data related to a user of the platform, he/she is informed by the system through a notification message which updates him/her with a few lines of the changes made.
Notification messages (which can be of many different types and in some way are related to all the modules of the system) are displayed in a specific area of the home page and can be sent by e-mail or even by SMS, in order to be sure that the addressee will consult them in real time. The power of Panoptikon notification system consists above all in the creation of a shortcut (direct link) that from the notification message allows the access to the function through which the user can check / validate / modify the update notified.
Basically, the notification system becomes a navigation tool that allows each user to monitor what is happening in his/her operational environment and immediately access to the basic functions, without making intermediate steps.
Guidelines and manuals
Panoptikon offers the user a particularly detailed and advanced contextual help system (Help online). The help online can be reached from every single page of the application and allows you to perform 4 different operations:
- Consult the explicative sheets of the pages of the function you are using.
- Perform a research on the contents of the sheets.
- Download the pdf files with the complete guidelines of the function.
- Contact Exagogica help desk by generating a support request ticket.
The explicative sheets are of two different types: descriptive documents of the functional elements and user guide (How to do it). The latter is particularly important because it also provides valuable methodological support explaining what can be done through the system and how to perform it. Actually, there are almost 1000 "how to do it" in the system for a total of about 7000 support slides.

Panoptikon help online is updated and certified in English and Italian each time the application is released. Therefore, its content is guaranteed and is always referred to the version in use at that time by the user.
The contents of the Help online are also used for the general Help Center of the system and for the generation of user profile manuals that can be downloaded in PDF format from the dashboards of each different profiles.